
Fed Speak:
- The FOMC convened January 28th and 29th, resulting in a pause on rate cuts, leaving the federal funds target rate between 4.25% and 4.5%. The Fed projects continued, albeit modest, GDP growth over the medium term, referencing ongoing global uncertainties--some of which are tied to trade policy under the new Trump administration. Economic activity remains on solid footing, and the labor market remains robust. Unemployment has stabilized at historically low levels, while wage growth has stabilized above inflation levels.
- Inflation remains above the Fed’s 2% target, though it is showing signs of gradual decline from highs and is expected to fall progressively towards the target as restrictive policy measures flow through the system at a bit of a lag.
- In addition to maintaining interest rate levels, Chair Powell confirmed that the Fed continues to reduce its balance sheet holdings of Treasury and agency securities. The Fed now has aggregate holdings of $6.8 trillion, down from a peak of nearly $9 trillion in 2022.
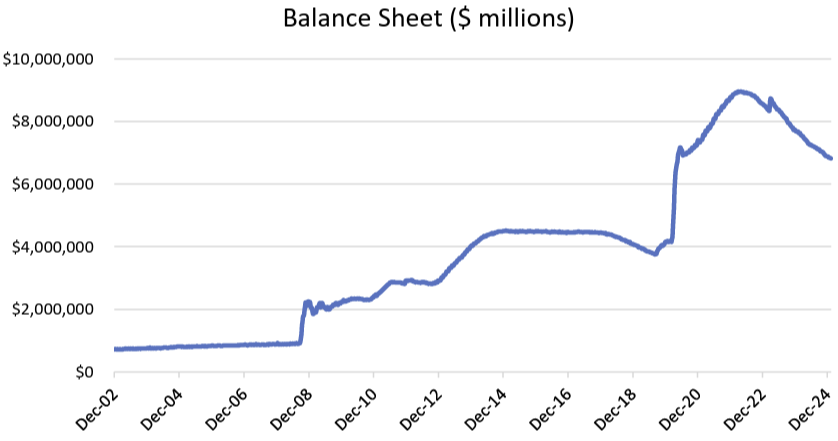
- Balance sheet policy has been discussed in this newsletter as a powerful Fed lever, though it doesn’t typically hit the news cycle like rate policy. As part of the Fed’s “normalization efforts,” they have been allowing holdings to mature and roll off the balance sheet rather than becoming active sellers. Importantly, though, the Fed is no longer a major market participant on the buy side, as they had been since the 2008 financial crisis.
- The Fed will remain data-dependent, and investors can expect the current interest rate levels to remain relatively static unless data readings indicate a weakening in the labor market and economic activity, or a significant rise in persistent inflation. Powell fielded questions from the press about the new administration, who has been vocal about interest rates and has policies that some view as being inflationary. The Fed didn’t comment on any communication with President Trump regarding rates and reiterated their commitment to reviewing data as it comes in, noting that economic forecasting is difficult beyond a month or two.
- The market is now pricing in the next rate cut in June of this year, with low confidence at 47% probability.
Macro Environment:
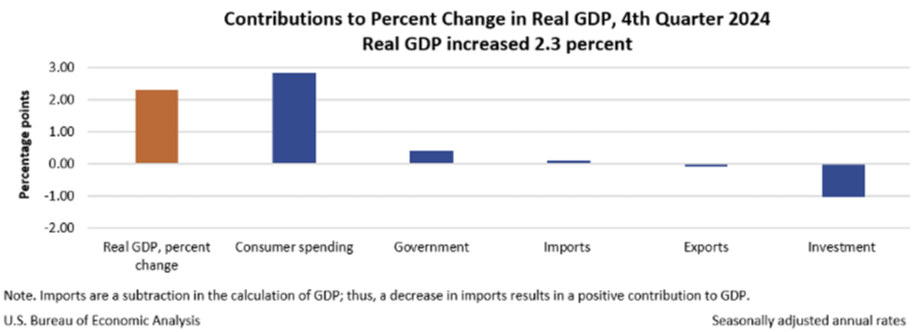
- Q4 GDP numbers showed real GDP increasing 2.3% year-over-year. This was slighlty down from the 3.1% growth in Q3 but still demonstrates solid footing for the U.S. economy. The primary driver of GDP growth was consumer spending, both on goods and services, followed by government expenditures. Services spending was driven by healthcare, while goods spending contributors were durable goods, such as automobiles and parts. Investment declined and detracted from real GDP growth, and net exports were not a meaningful contributor. For all of 2024, real GDP grew 2.8%, compared with a 2.9% increase in 2023.
- President Trump’s inauguration was well-attended, and he wasted no time getting to work with a slew of executive orders and efforts to get his nominations approved by Congress. A key part of his campaign were the use of tarrifs, either as a source of financing and/or a trade negotiation tool, so it’s no surprise that this power was wielded strongly in the first couple weeks of his administration. Other aspects of his policy proposals include pro-growth measures such as deregulation and tax cuts, but the details remain unclear and will likely not be revealed until his cabinet appointees are confirmed. Any sustained trade war will have inflationary pressures. Consumer inflation expectations have risen, in part due to trade policy and the potential for tarrifs, though growth tailwinds remain positive with a healthy economic backdrop.
- The employment landscape remained strong, with 216,000 jobs added in December--slightly below November's 227,000 gain but still above the forecasted 190,000. Employment continued to grow in healthcare, hospitality, and government, while retail trade lost another 21,000 jobs due to ongoing structural shifts. The unemployment rate remained steady at 4.2%, and the labor force participation rate remained unchanged month-over-month at 62.5%, relatively range-bound since the end of 2023.
- Inflation ticked slightly higher to close out 2024. December headline PCE rose 0.3% month-overmonth, translating to a 2.6% YoY increase, up from 2.4% in November. Core PCE remained steady at 2.8% YoY, indicating persistent inflationary pressures, particularly in shelter (4.6% YoY) and transportation services (3.4% YoY). Energy prices, which had previously been a major driver of disinflation, stabilized higher in December. Oil prices ended the year at $76 per barrel, introducing some uncertainty about inflation trends heading into 2025.
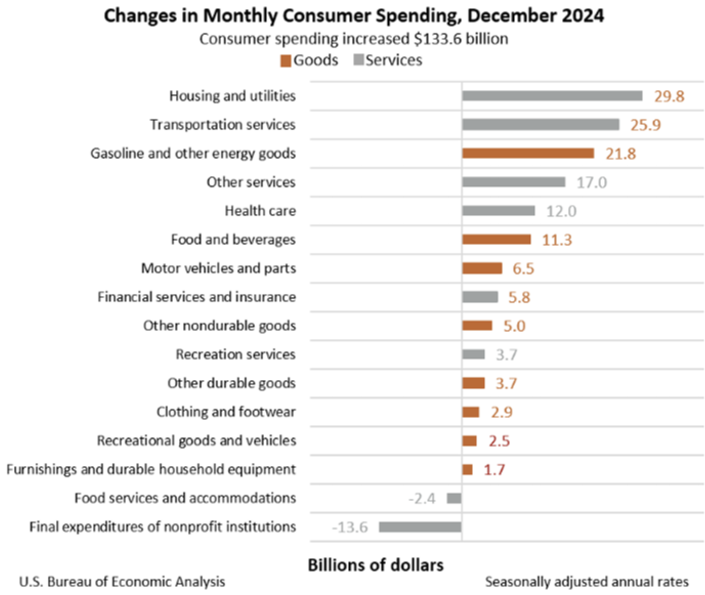
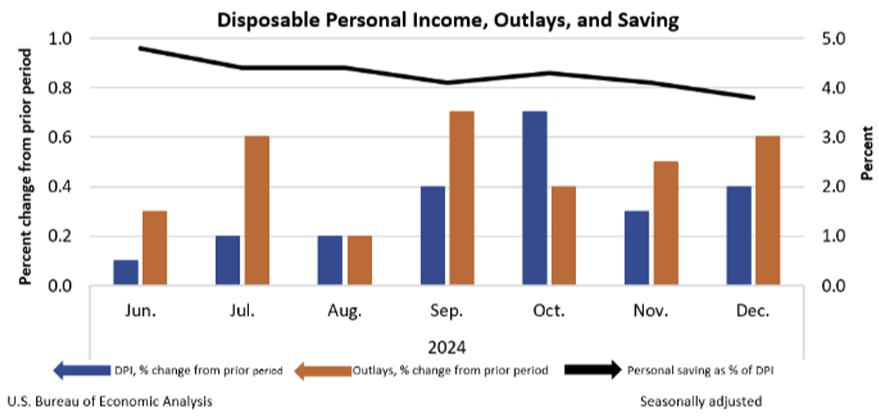
- The U.S. Bureau of Economic Analysis released its report on Personal Income and Outlays for December 2024. Personal income increased by $92 billion, or 0.4% month-over-month. Disposable income also increased 0.4% month-over-month, or $79.7 billion. PCE grew by $133.6 billion, up 0.7%, with services spending up $78.2 billion, driven by upticks in healthcare, housing and utilities, and transportation services and goods.
Market Performance and Outlook:
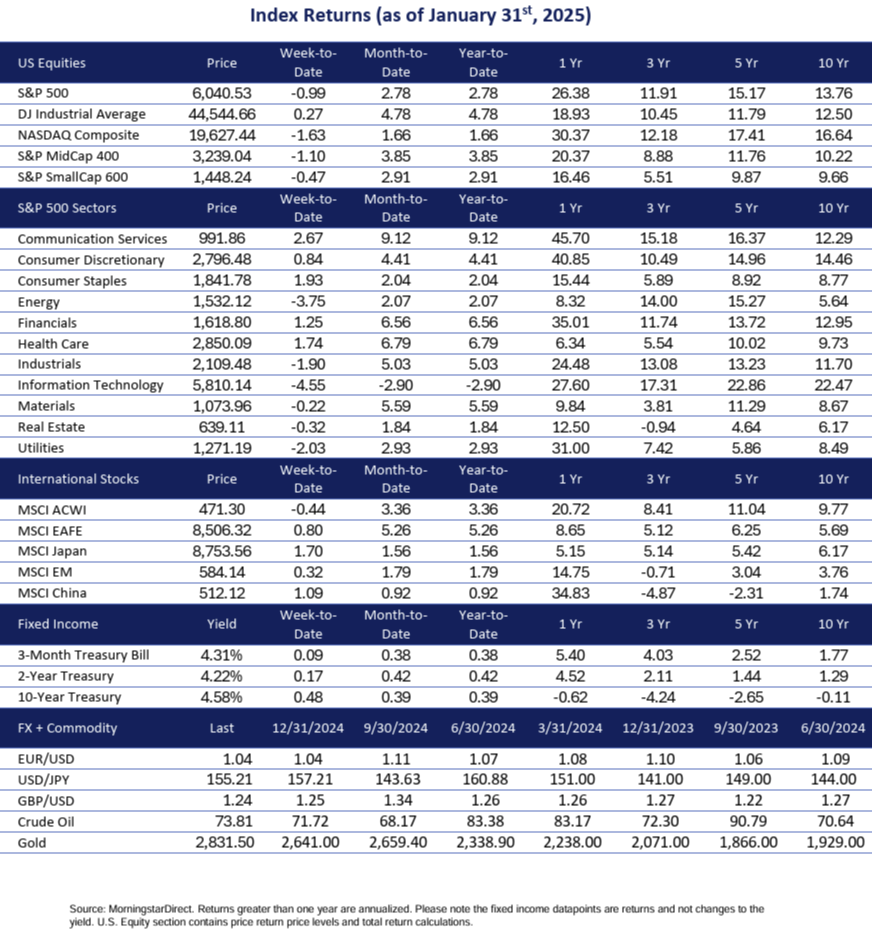
- The market rebounded in January after a sharp selloff in December, with most major indices in the green. Throughout 2025, we expect market leadership to broaden beyond the “priced to perfection” mega-cap technology sector names that drove the S&P higher in 2024. This was evident in January’s equity returns, with previously depressed sectors like healthcare and materials rising 6.79% and 5.59%, respectively. All U.S. sectors were in the green in January, except for technology stocks, which were down 2.90%.
- Technology weakness in January was propelled by a late-month introduction of a new Chinese Large Language Model (LLM) called DeepSeek. The AI model was released as open source and boasted performance metrics similar to those of leading U.S. AI models, at purportedly a fraction of the training costs. The release stirred up Silicon Valley and Wall Street, as technologists and analysts weighed the implications of steep capex spend by leading U.S. AI companies. While the cost claims have yet to be verified, they forced U.S. companies to contend with renewed competition and a need to become more efficient. The U.S. still has the leading AI companies, researchers, and investment, and stands to maintain market leadership. The market responded with heavy selling of Nvidia and other semiconductor names.
- Earnings season kicked off in January as companies began reporting for Q4 2024. By 1/31/25, 36% of S&P 500 companies had reported, with 77% reporting a positive EPS surprise and 63% reporting a positive revenue surprise. According to FactSet research, the blended earnings growth rate for the S&P 500 is 13.2%, which, if it holds as more companies report, will mark the highest earnings growth rate since Q4 2021. The forward twelve-month P/E ratio for the S&P is 22.0x, which is rich compared to the 5-year average of 19.8x and the 10-year average of 18.2x.
- The market has been rewarding companies that reported positive surprises and favorable guidance. A notable example is Netflix, which reported actual earnings $4.27 per share for Q4, compared with consensus of $4.21. With strong reported user growth in the face of increased tier pricing, investors bid up NFLX by about 15% on the news.
- From a factor perspective, most factors were in the green in January, marking a strong start to the year. The momentum factor was favored once again, with a 5.41% return for the month. Notably, the equal-weight and value factors posted strong monthly returns at 4.16% and 4.42%, respectively, supporting the thesis that market leadership will diversify over the next year. To that end, financials and industrials have both outperformed technology over the past six months.
- International stocks outperformed the U.S. in January, with the MSCI EAFE returning 5.65%. EM stocks were more muted, rising 1.79%. EM stocks, including China, are more sensitive to tariff pressures, as they represent primarily export-driven economies and have more supply chain exposure.
- In the world of fixed income, there were a couple twists at various points along the Treasury yield curve, but month-over-month changes were relatively muted. The 10-year began and ended January at 4.58%, though reached as high as 4.79% in the month. The U.S. Aggregate bond index rose 65 bps in the month. Shorter duration assets and inflation-protected securities outperformed in the month, with 10-year TIPS returning 1.19%.
Securities and advisory services offered through Independent Financial Group, LLC, a Registered Investment Adviser. Member FINRA/SIPC.